First Steps
Now that NestLens is running, let's explore the dashboard.
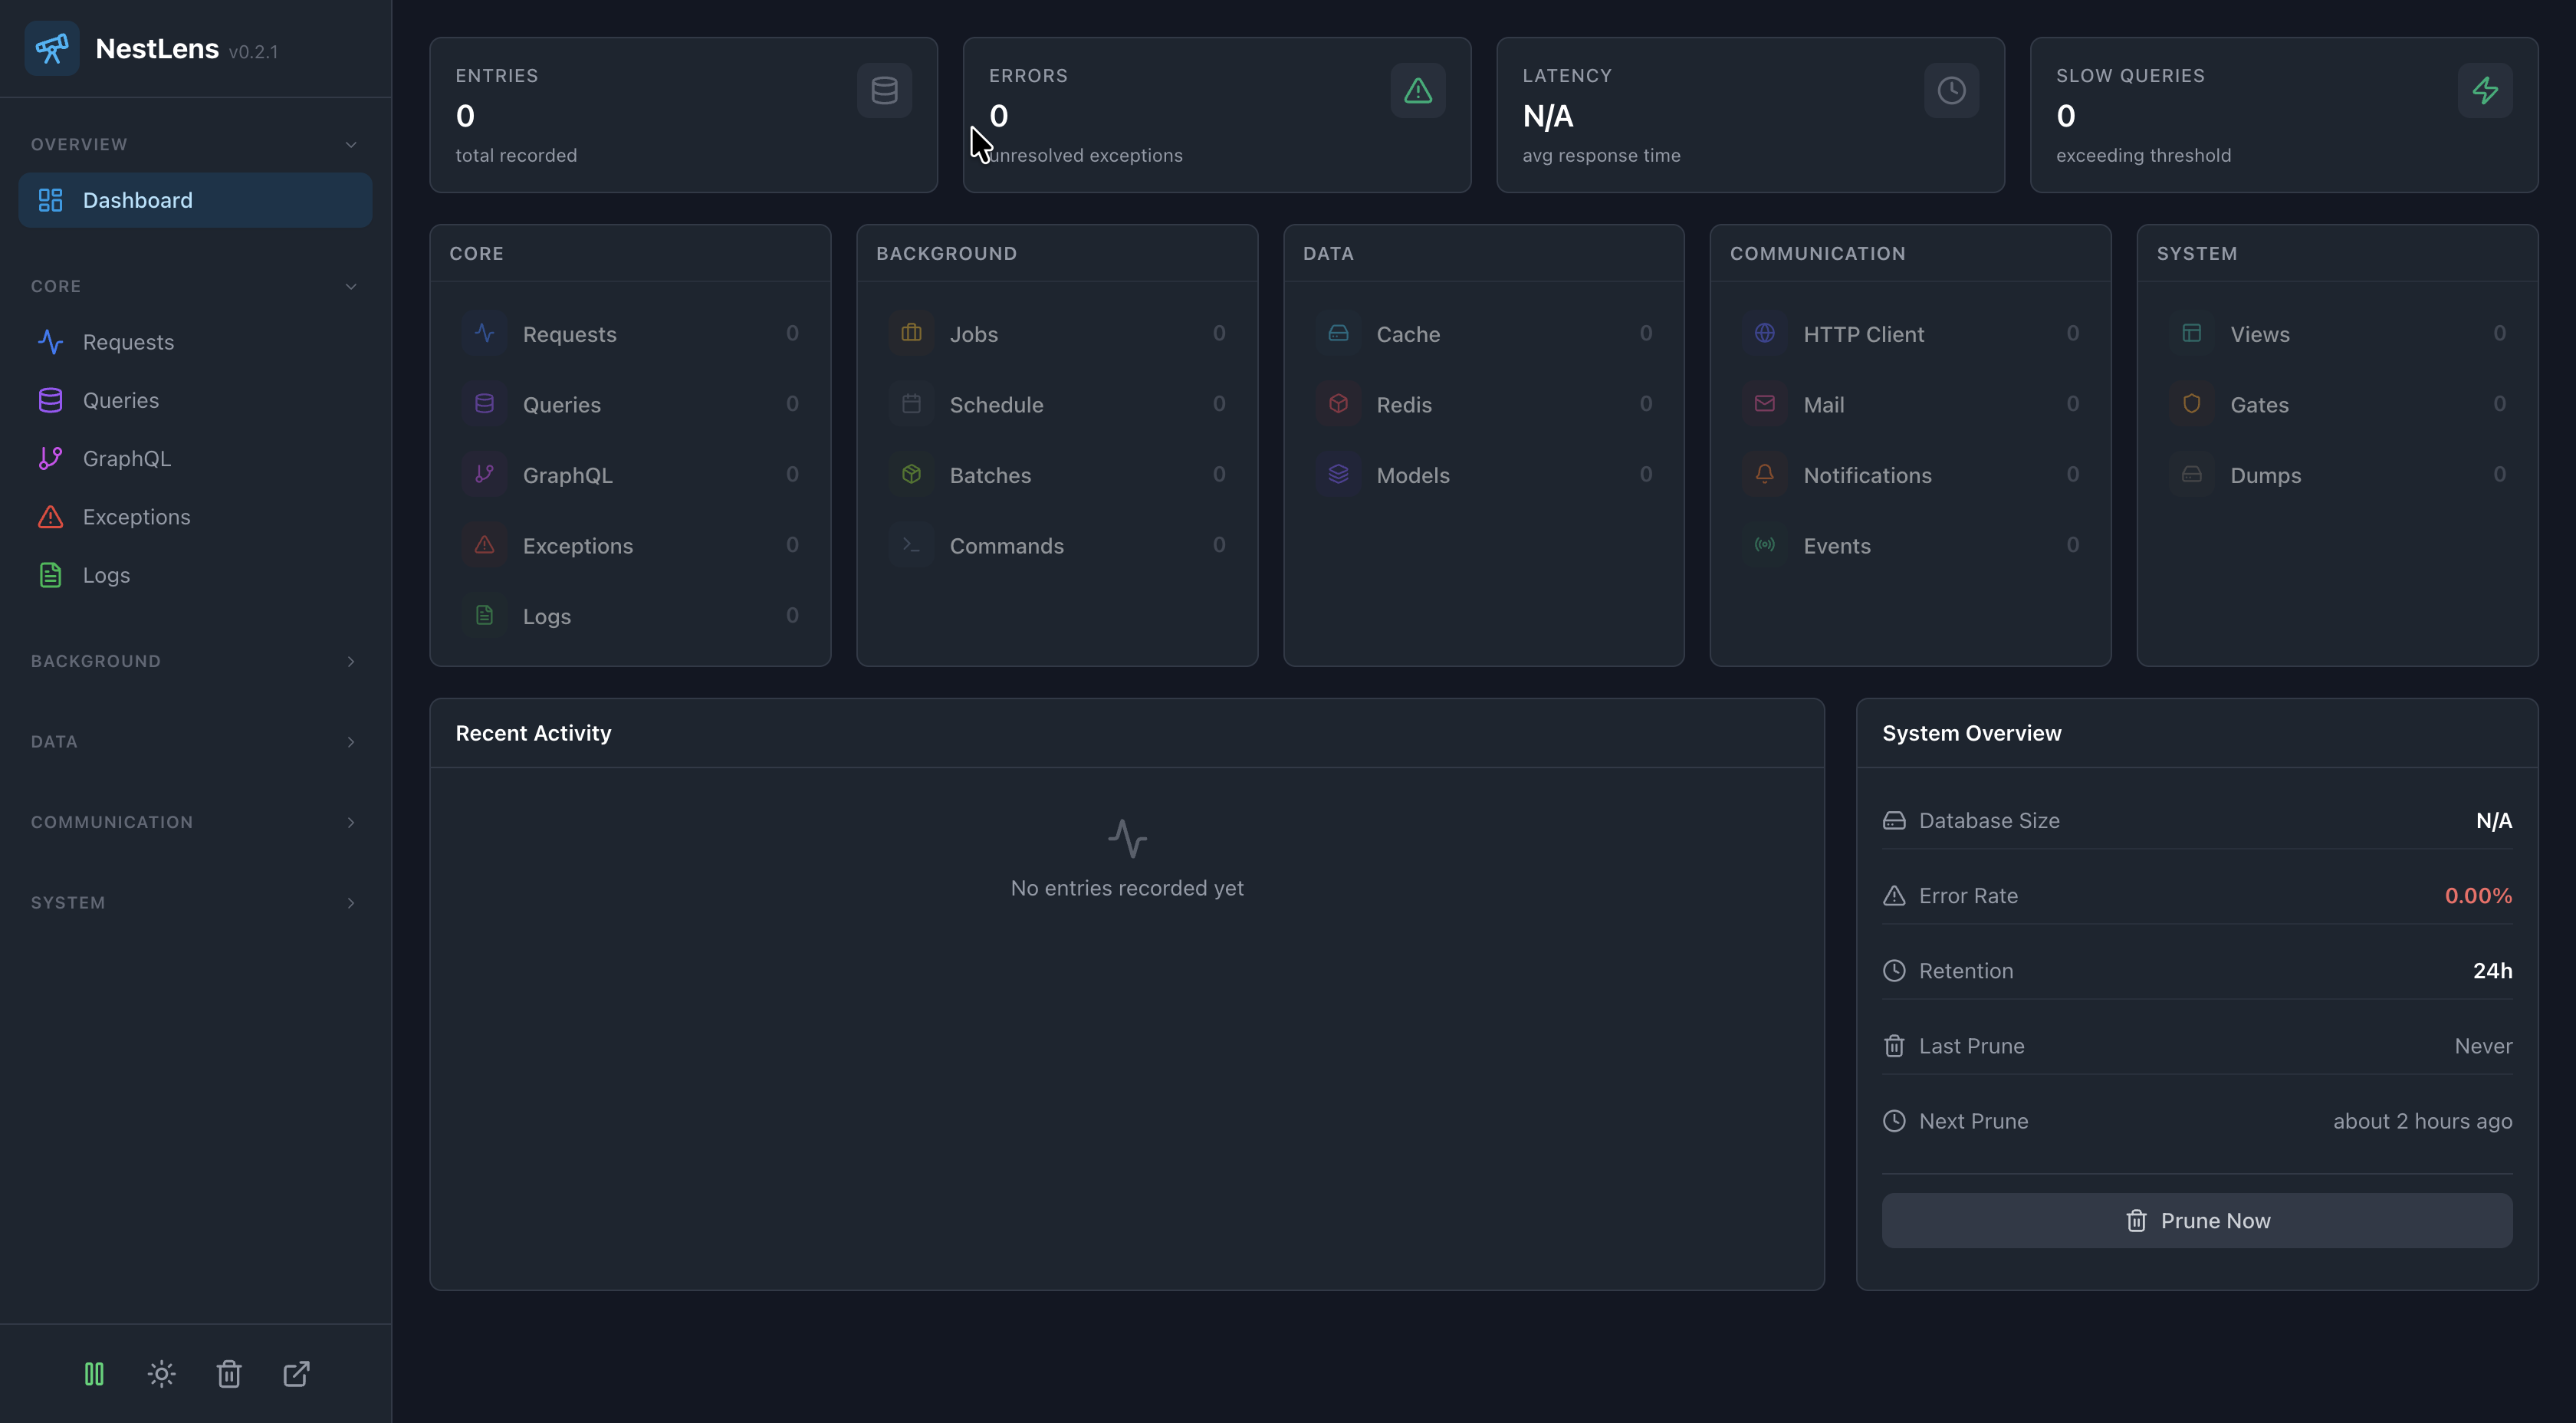
Dashboard Overview
The NestLens dashboard is divided into several sections:
Sidebar Navigation
- Dashboard - Overview with key metrics
- Requests - HTTP request/response tracking
- Queries - Database query monitoring
- Exceptions - Error tracking
- Logs - Application logs
- And 14 more entry types...
Key Metrics
The dashboard shows real-time metrics:
- Total entries
- Error count
- Average response time
- Slow query count
Generating Sample Data
To see NestLens in action, make some requests to your app:
# Make a few requests
curl http://localhost:3000/
curl http://localhost:3000/api/users
curl http://localhost:3000/non-existent  # 404 error
Refresh the dashboard to see the entries appear.
Understanding Entries
Each entry in NestLens contains:
- Type - Request, Query, Exception, Log, etc.
- Timestamp - When it occurred
- Details - Type-specific information
- Tags - Auto-generated and custom tags
- Family Hash - Groups similar entries
Filtering
Click on any badge (method, status code, etc.) to filter entries. Filters are:
- URL-based (shareable)
- Combinable (multiple filters at once)
- Removable via the header
Dark Mode
Toggle dark mode with:
- The sun/moon icon in the sidebar
- Keyboard shortcut:
Ctrl/Cmd + D
Keyboard Shortcuts
Ctrl/Cmd + K- Clear all entriesCtrl/Cmd + D- Toggle dark modeArrow Keys- Navigate table rowsEnter- Open entry detailsEscape- Close modals
Next Steps
- Basic Configuration - Customize settings
- Watchers Overview - Enable more tracking
- Security - Protect the dashboard