Dashboard Overview
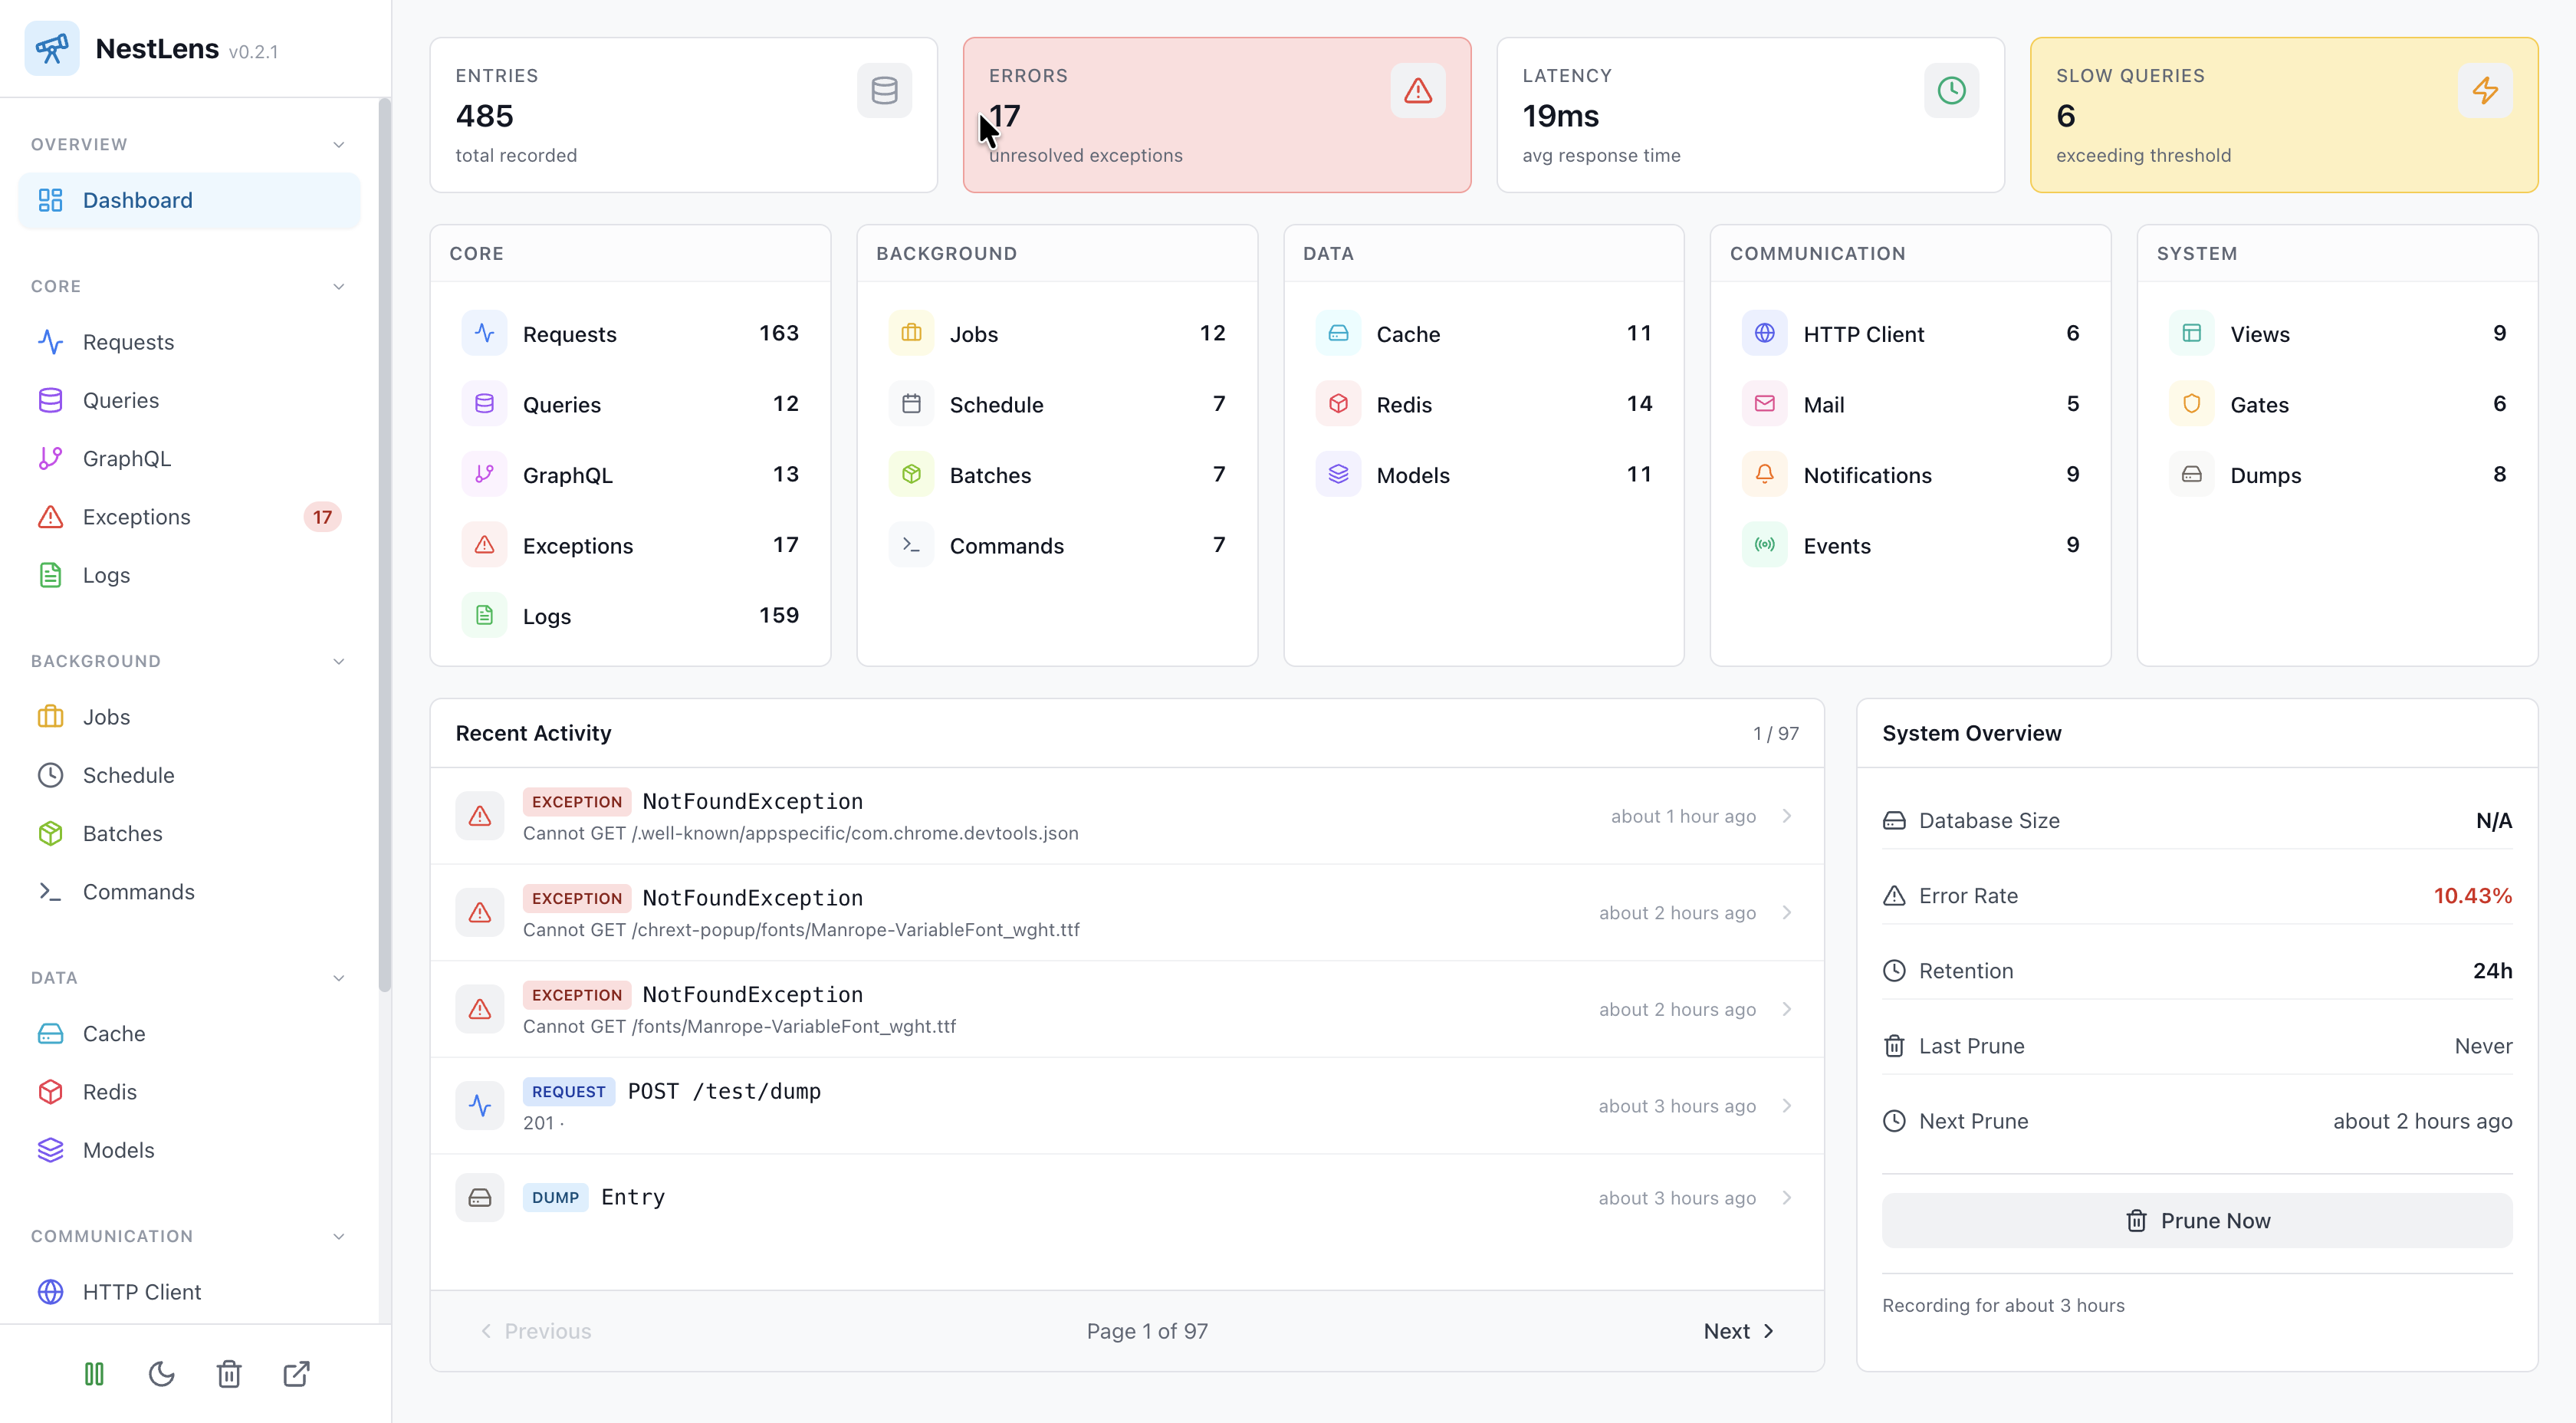
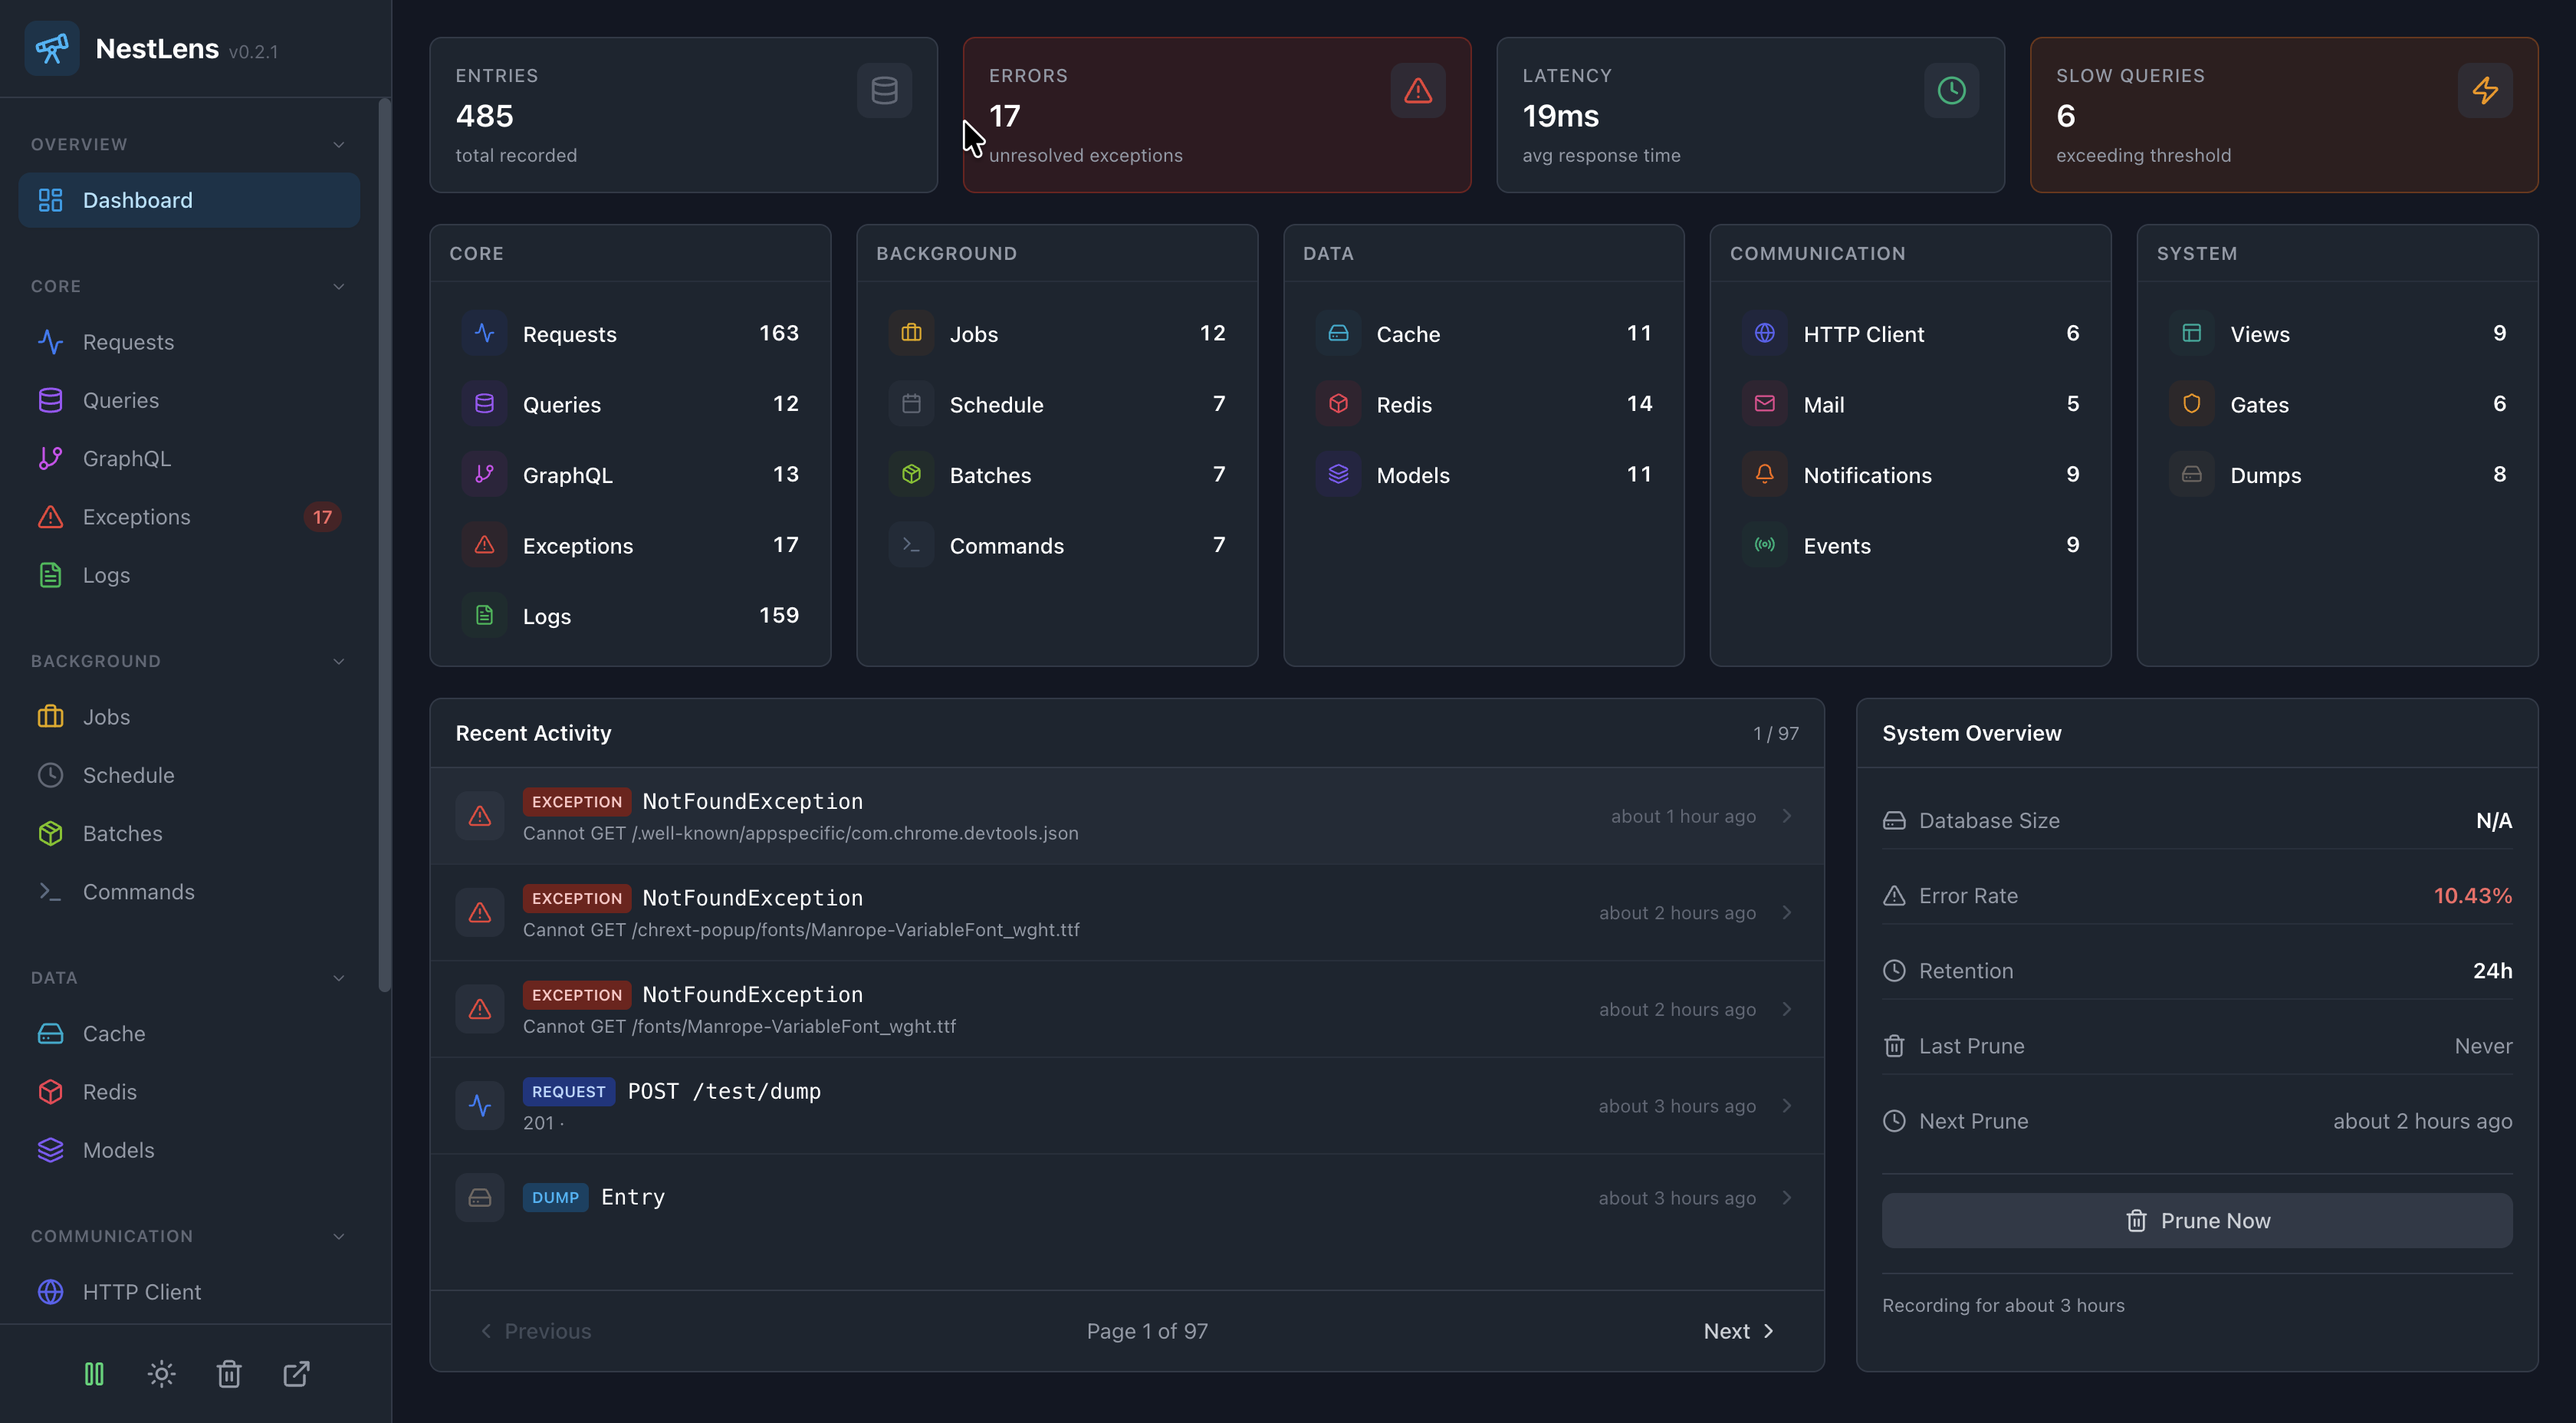
The NestLens dashboard provides a powerful, real-time interface for monitoring and debugging your NestJS application. Built with a modern, responsive design, it offers comprehensive insights into all aspects of your application's behavior.
Key Features
Real-Time Monitoring
The dashboard updates automatically as new entries are collected, giving you live visibility into:
- HTTP requests and responses
- Database queries and performance
- Exceptions and errors
- Background jobs and scheduled tasks
- Cache operations
- Event dispatching
- And 18 total entry types
Entry Type Groups
The dashboard organizes entries into six logical navigation groups for easy access:
- Web - HTTP requests, exceptions, and client requests
- Database - Queries and model operations
- Background - Jobs, schedules, batches, and commands
- Communication - Mail, notifications, and events
- Infrastructure - Cache, Redis, and gates
- System - Logs, views, and dumps
Performance Insights
Track application performance with built-in metrics:
- Request response times
- Query execution duration
- Slow query detection (configurable threshold)
- Memory usage per request
- Job processing times
- Database operation metrics
Data Visualization
Each entry type has a tailored display showing relevant information:
- Requests - Method, path, status code, duration, and response details
- Queries - SQL/query text, parameters, execution time, and slow query indicator
- Exceptions - Error type, message, stack trace, and context
- Jobs - Queue name, status, attempts, and processing duration
- And more - Each of the 18 entry types has optimized visualization
Dashboard Layout
Navigation Sidebar
The left sidebar provides quick access to all entry types, organized by category. Each navigation item shows:
- Entry type icon and name
- Real-time count badge (if entries exist)
- Active state indicator
Main Content Area
The central area displays:
- Filter Bar - Quick access to active filters and search
- Entry List - Paginated list of entries with key information
- Detail View - Full entry details when selected
Header Controls
The top bar includes:
- Search - Full-text search across entries
- Filters - Advanced filtering options
- Refresh - Manual refresh trigger
- Settings - Dashboard preferences
Auto-Refresh
The dashboard automatically polls for new entries every 3 seconds when viewing the latest entries. This ensures you always see the most recent activity without manual refreshing.
Auto-refresh is intelligent:
- Pauses when viewing older entries (historical browsing)
- Resumes when returning to the latest view
- Only fetches new data (not full reload)
- Minimal performance impact
Entry Detail Views
Click any entry to view comprehensive details including:
Common Fields
- ID - Unique sequence number
- Created At - Timestamp with millisecond precision
- Request ID - Correlation ID for related entries
- Tags - Custom and auto-generated tags
- Family Hash - Groups similar entries (exceptions, errors)
Type-Specific Fields
Each entry type displays relevant payload data:
- Request headers and body
- Query parameters and results
- Exception stack traces
- Job data and results
- And much more
Browser Support
The dashboard is optimized for modern browsers:
- Chrome 90+
- Firefox 88+
- Safari 14+
- Edge 90+
Mobile Responsiveness
While optimized for desktop use, the dashboard is fully responsive and works on tablets and mobile devices with adapted layouts for smaller screens.
Next Steps
- Learn about Navigation Groups
- Explore Filtering Options
- Master Keyboard Shortcuts