GraphQL Watcher
The GraphQL Watcher tracks all GraphQL operations (queries, mutations, and subscriptions) in your NestJS application, capturing detailed information about performance, errors, and N+1 query detection.
What Gets Captured
- Operation type (query, mutation, subscription)
- Operation name and query string
- Variables (with sensitive value masking)
- Response data (optional)
- GraphQL errors — and, for what a resolver threw, an
exceptionentry beside the operation, so the Exceptions page,stats,sampling.alwaysand alerting work here as they do for HTTP (seerecordExceptions) - Execution timing (parsing, validation, execution)
- Field-level resolver traces (optional)
- N+1 query detection
- Subscription lifecycle events
- Client IP and user agent
- Authenticated user information
- Batch operation tracking
:::info Persisted queries Automatic persisted queries are recorded like any other operation. With APQ a client sends the document once and only its hash afterwards, and Apollo resolves the text from its cache after the request has started — an adapter that reads the query when the request begins sees nothing on every call but the first. NestLens waits for the text and records all of them, and an operation whose hash the server could not resolve is recorded under that hash, since a cache that keeps missing is worth seeing.
Mercurius resolves a persisted query before its hooks run, so nothing there is affected. :::
Supported GraphQL Servers
NestLens automatically detects and supports:
- Apollo Server (
@apollo/server) - Mercurius (Fastify GraphQL)
Configuration
NestLensModule.forRoot({
  watchers: {
    graphql: {
      enabled: true,
      server: 'auto', // 'apollo' | 'mercurius' | 'auto'
      captureVariables: true,
      captureResponse: false,
      ignoreIntrospection: true,
      ignoreOperations: ['HealthCheck'],
      detectN1Queries: true,
      n1Threshold: 10,
      traceFieldResolvers: false,
      subscriptions: {
        enabled: true,
        trackMessages: false,
        trackConnectionEvents: true,
      },
      tags: async (ctx) => {
        return [ctx.operationType, ctx.operationName ?? 'anonymous'];
      },
    },
  },
})
Configuration Options
| Option | Type | Default | Description |
|---|---|---|---|
enabled | boolean | false | Enable/disable GraphQL tracking |
server | string | 'auto' | GraphQL server type: 'apollo', 'mercurius', or 'auto' |
maxQuerySize | number | 8192 | Maximum query size to capture (bytes) |
captureVariables | boolean | true | Capture operation variables |
maxVariablesSize | number | 65536 | Maximum size of the recorded variables (bytes) |
sensitiveVariables | string[] | { replace: string[] } | ['password', 'token', ...] | Variable names to mask, added to the defaults and to security.dataMasking.sensitiveParams |
ignoreIntrospection | boolean | true | Ignore introspection queries |
ignoreOperations | string[] | [] | Operation names to ignore |
recordExceptions | boolean | true | Also record what a resolver threw as an exception entry |
traceFieldResolvers | boolean | false | Enable field-level resolver tracing |
traceSlowResolvers | number | undefined | Only trace resolvers slower than this (ms) |
resolverTracingSampleRate | number | 0.1 | Sample rate for resolver tracing (0-1) |
detectN1Queries | boolean | true | Enable N+1 query detection |
n1Threshold | number | 10 | Resolver call count to trigger N+1 warning |
samplingRate | number | 1.0 | Overall sampling rate (0-1) |
captureResponse | boolean | false | Capture response data |
maxResponseSize | number | 65536 | Maximum response size to capture (bytes) |
tags | function | undefined | Function to generate custom tags |
What raising maxResponseSize costs
A captured response is serialized and walked key by key on your application's event loop, so this option buys detail with latency added to the operation that returned it:
| Response | Cost per operation |
|---|---|
| 70 KB | ~0.3 ms |
| 280 KB | ~1.2 ms |
| 980 KB | ~3.7 ms |
| 4900 KB | ~27 ms |
The cost is linear in the size of the response. Responses over the limit are cheap — around 0.2 ms whatever their size, because they are rejected without being serialized — so the table describes the responses you choose to keep, and raising the limit is what moves a response into it.
64 KB is enough to read a response on the dashboard. Reach for
ignoreOperations or a lower samplingRate before reaching for a bigger limit.
Run npm run benchmark:sanitizer to measure this on your own hardware rather
than trusting figures from someone else's.
Subscription Options
| Option | Type | Default | Description |
|---|---|---|---|
enabled | boolean | true | Track subscriptions |
trackMessages | boolean | false | Track individual subscription messages |
captureMessageData | boolean | false | Capture message payload data |
maxTrackedMessages | number | 100 | Maximum messages to track per subscription |
trackConnectionEvents | boolean | true | Track connection/disconnection events |
Payload Structure
interface GraphQLEntry {
  type: 'graphql';
  payload: {
    operationName?: string;           // Operation name (if named)
    operationType: 'query' | 'mutation' | 'subscription';
    query: string;                    // GraphQL query string
    queryHash: string;                // Hash for grouping similar queries
    variables?: Record<string, unknown>;

    // Timing
    duration: number;                 // Total duration (ms)
    parsingDuration?: number;         // Query parsing time (ms)
    validationDuration?: number;      // Query validation time (ms)
    executionDuration?: number;       // Resolver execution time (ms)

    // Response
    statusCode: number;               // HTTP status (200, 400, 500, etc.)
    hasErrors: boolean;               // Whether response contains errors
    errors?: GraphQLErrorInfo[];      // GraphQL errors
    responseData?: unknown;           // Response data (if captured)

    // Performance
    resolverCount?: number;           // Number of resolver calls
    fieldCount?: number;              // Number of fields in selection
    depthReached?: number;            // Maximum query depth

    // N+1 Detection
    potentialN1?: PotentialN1Warning[];

    // Client context
    ip?: string;
    userAgent?: string;
    user?: RequestUser;

    // Batching
    batchIndex?: number;              // Index in batch (0-based)
    batchSize?: number;               // Total batch size
    batchId?: string;                 // Batch identifier

    // Subscriptions
    subscriptionId?: string;
    subscriptionEvent?: 'start' | 'data' | 'error' | 'complete';
    messageCount?: number;
    subscriptionDuration?: number;

    // Field traces (opt-in)
    fieldTraces?: GraphQLFieldTrace[];
  };
}
Usage Example
GraphQL monitoring is zero-config. Once you enable the watcher with graphql: true, NestLens auto-detects whether you are running Apollo Server or Mercurius and registers the necessary plugin/hooks for you. No manual plugin wiring is required.
Apollo Server Integration
Just enable the watcher. NestLens detects @nestjs/apollo / @apollo/server and automatically registers its Apollo plugin during module setup:
@Module({
  imports: [
    NestLensModule.forRoot({
      watchers: {
        graphql: true,
      },
    }),
    GraphQLModule.forRoot({
      driver: ApolloDriver,
      autoSchemaFile: true,
    }),
  ],
})
export class AppModule {}
You no longer need to inject GraphQLWatcher and add graphqlWatcher.getPlugin() manually — the plugin is wired up for you.
Mercurius Integration
Mercurius is handled automatically as well. NestLens detects mercurius / @nestjs/mercurius and registers its hooks via onApplicationBootstrap after Fastify is ready:
@Module({
  imports: [
    NestLensModule.forRoot({
      watchers: {
        graphql: true,
      },
    }),
    GraphQLModule.forRoot({
      driver: MercuriusDriver,
      autoSchemaFile: true,
    }),
  ],
})
export class AppModule {}
No manual fastify.register(mercurius, { hooks: ... }) wiring is required.
N+1 Query Detection
The GraphQL Watcher automatically detects potential N+1 query issues by tracking resolver call patterns:
// Example: N+1 warning
{
  potentialN1: [{
    field: 'posts',
    parentType: 'User',
    count: 50,
    suggestion: 'Consider using DataLoader for User.posts field'
  }]
}
Configure N+1 detection:
NestLensModule.forRoot({
  watchers: {
    graphql: {
      detectN1Queries: true,
      n1Threshold: 10, // Warn when a resolver is called 10+ times
    },
  },
})
Field-Level Tracing
Enable detailed resolver timing for performance optimization:
NestLensModule.forRoot({
  watchers: {
    graphql: {
      traceFieldResolvers: true,
      resolverTracingSampleRate: 0.1, // 10% sampling
      traceSlowResolvers: 50, // Only trace resolvers > 50ms
    },
  },
})
Subscription Tracking
Subscription tracking needs no wiring. NestLens instruments the built schema
once the application has started, so it sees every subscription whichever
server and whichever WebSocket protocol you use — Apollo with graphql-ws,
the older subscriptions-transport-ws, or Mercurius.
Four events can be recorded, three of them by default, all sharing one
subscriptionId:
| Event | When | Recorded by default |
|---|---|---|
start | the client subscribes | yes |
data | a message is pushed | no — set trackMessages |
error | the stream fails | yes |
complete | the subscription ends | yes |
Messages are off by default because a busy subscription produces a great many
of them. captureMessageData additionally stores the message body, which goes
through the same masking as every other payload.
Track WebSocket subscription lifecycle:
NestLensModule.forRoot({
  watchers: {
    graphql: {
      subscriptions: {
        enabled: true,
        trackMessages: true, // Track each message
        captureMessageData: false, // Don't capture message content
        trackConnectionEvents: true,
      },
    },
  },
})
Dashboard View
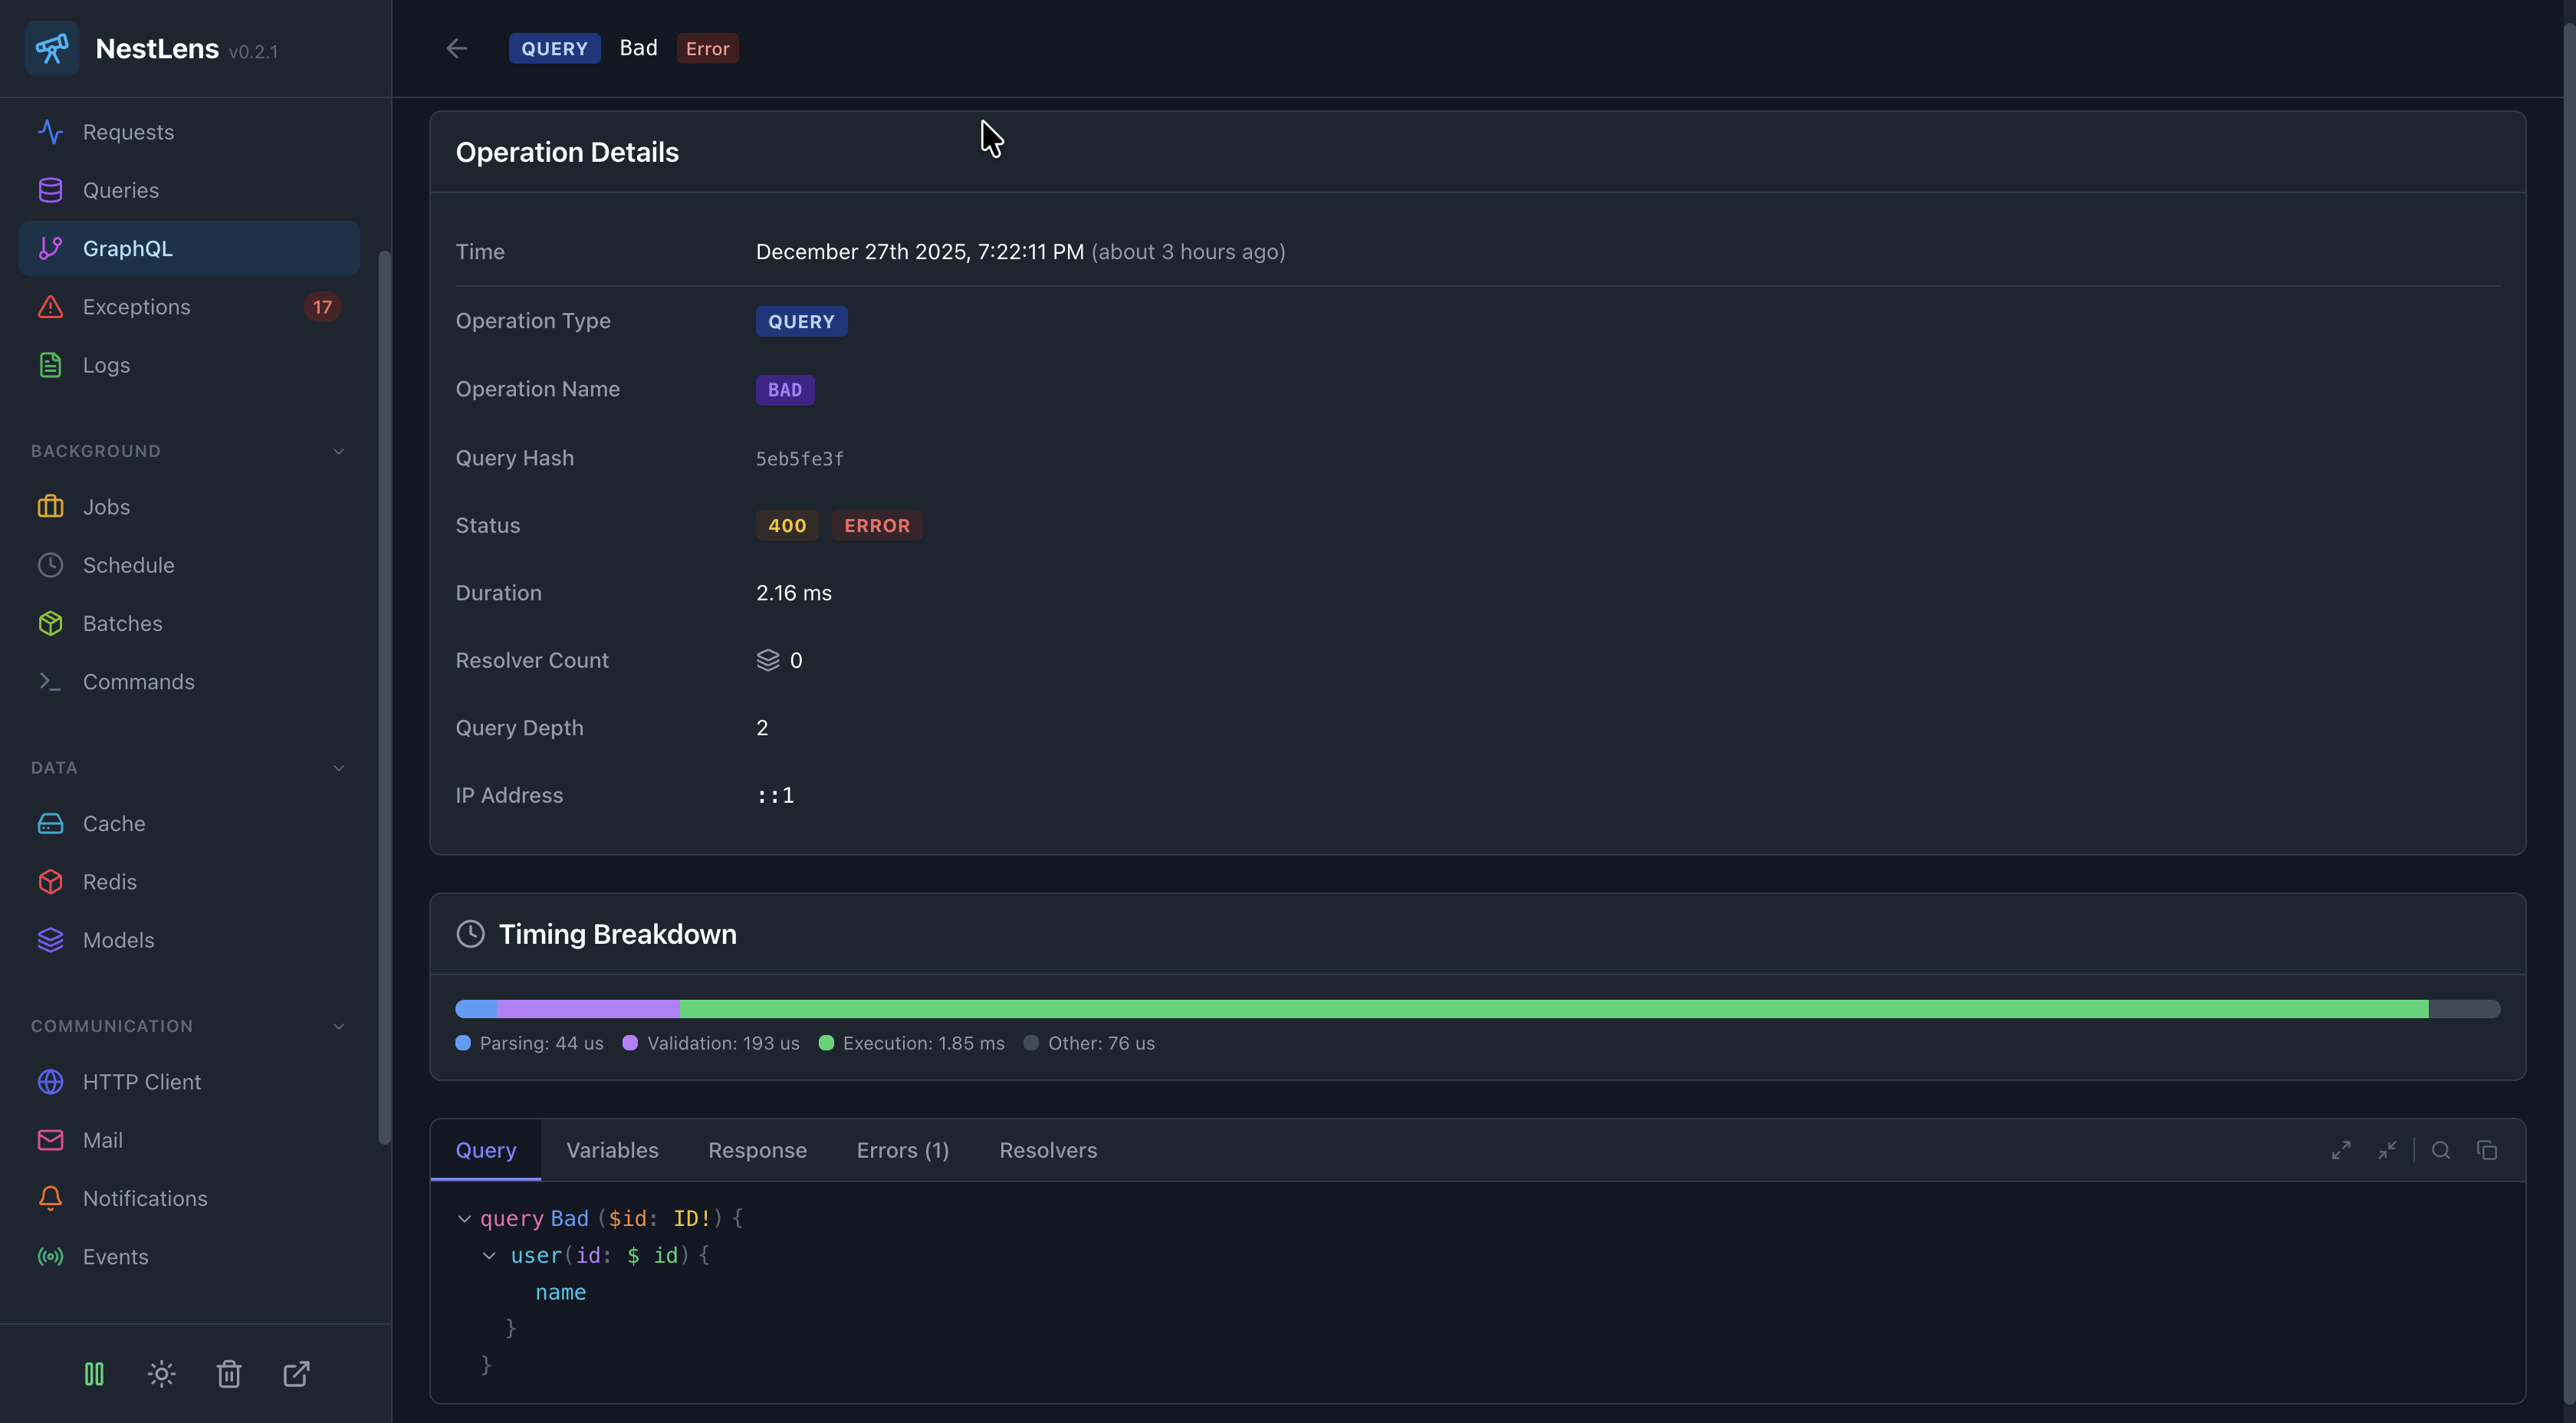
In the NestLens dashboard, GraphQL entries appear in the GraphQL tab showing:
- Timeline view of all operations
- Operation type badges (Query, Mutation, Subscription)
- Error highlighting
- N+1 warnings
- Query hash grouping
- Subscription lifecycle events
- Field-level timing waterfall (when enabled)
Filters Available
- Filter by operation type
- Filter by operation name
- Filter by error status
- Filter by N+1 warnings
- Filter by query hash
- Filter by IP address
- Search by query content
Sensitive Data Handling
The GraphQL Watcher automatically masks these sensitive variables by default:
passwordtoken,secretapiKey,api_keyaccessToken,access_tokenrefreshToken,refresh_tokenauthorizationapiSecret,api_secretprivateKey,private_keycreditCard,credit_cardssn,pin
How a Variable Name Is Matched
A term matches whole words in the name. apiToken, api_token and API-TOKEN
are one field written three ways, so the list does not have to enumerate them,
and a multi-word term matches a run of words — credit_card catches
creditCardNumber.
A term found in the middle of a name still masks when what follows only names
something made from the field: passwordHash, stripeSecretKey,
creditCardNumber and token_2 are all masked. A word that describes the field
rather than deriving from it is not: tokenCount is a number of tokens and
stays readable.
The plural is the same field: tokens, apiKeys and creditCards are masked
by the singular terms in the list, because a schema names a collection for what
it holds. So is a name carrying an index or a revision — token2, password1,
apiKeyV2 — whether or not a separator marks it off.
A term ending in * keeps the loose prefix match it has always had —
secret* matches any name starting with those letters.
Which Terms Apply
Three lists are masked for, as one:
- the defaults above,
- everything
security.dataMasking.sensitiveParamsmasks, including its defaults —cvv,cvc,card_number,passwd,social_securityand anything you added there, - whatever
sensitiveVariablesnames.
The third adds to the first two. That matters here more than elsewhere: the watcher builds a clean copy of the variables and the response and marks it, and the collector does not walk a marked payload a second time. For a GraphQL entry this list is the whole of the masking, with nothing behind it.
To mask exactly what you name and drop both built-in lists, say so:
graphql: {
  sensitiveVariables: { replace: ['orderNote', 'internalRef'] },
}
That is the way to make a default term readable — a pin field that really is
a map pin, a secret column holding a room number. It applies to GraphQL
payloads only; other watchers keep masking whatever
security.dataMasking.sensitiveParams says.
:::info Changed in 0.10.0
Matching used to be a plain substring test, so the default list's pin masked
shipping, shoppingCart, spinner, topping and isPinned, and the
dashboard showed *** for values the API never sent. If you added a short term
to sensitiveVariables and relied on it catching a name it appears inside —
id inside identityDocument, say — add the fuller name or a * wildcard.
sensitiveVariables also used to substitute for the default list rather than
adding to it. The difference was invisible, because the collector masked the
defaults afterwards regardless; now that it does not, the option does what it
reads as. Use { replace: [...] } for the old behaviour.
:::
Customize sensitive variable detection:
NestLensModule.forRoot({
  watchers: {
    graphql: {
      sensitiveVariables: [
        'password',
        'secret',
        'myCustomSecret',
      ],
    },
  },
})
Performance Considerations
- Introspection: Ignored by default to reduce noise
- Sampling: Use
samplingRatefor high-traffic APIs - Field tracing: Enable only when debugging performance issues
- Response capture: Disabled by default to reduce storage
Related Watchers
- Request Watcher - See HTTP layer for GraphQL requests
- Exception Watcher - See resolver exceptions
- Log Watcher - See logs during GraphQL execution
- Query Watcher - See database queries during resolvers